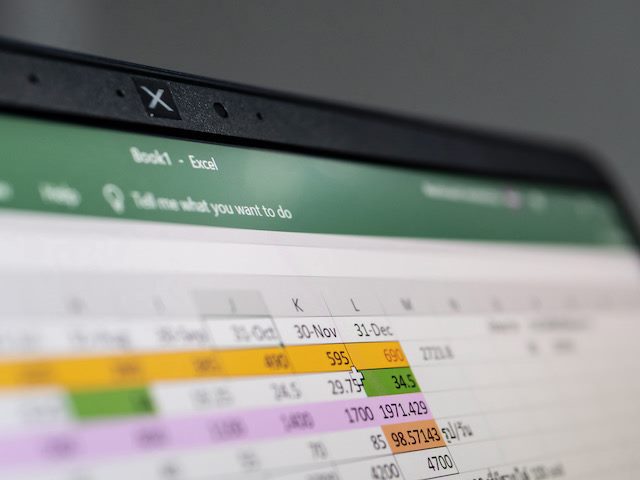

PHOTO:
Wachiwit | adobe stock
Business leaders love reliability. It’s essential for delivering results. One long-term love affair which continues today is with Excel. Since its release in 1987, Excel has built a reputation for reliability, with a decades-long track record of proven utility in a variety of business cases. Yet better alternatives have emerged, which raises the question — does Excel still have a place in business operations?
If you’re one of the Excel loyal, ask yourself: When is it a good time to use Excel spreadsheet? When should I use an alternative?
To answer those questions, look at how the recent applications for Excel have changed. A quick look around the internet or a talk with analysts will show a range of opinions on the value Excel spreadsheets provide. But the one thing that is clear is innovations in the world of Excel spreadsheets simultaneously create new opportunities and risks for data accuracy.
Excel: No Programming Language Necessary
Spreadsheets are a table of lists, offering a straightforward way to add data and set up formulas. Unlike a programming language, with Excel you can focus on connecting data to the right formulas.
Spreadsheets also allow you to leverage capable, if basic, computational features. Data is recalculated in real-time, so when you add new formulas to your spreadsheet, you don’t need to think about resetting a computation. In contrast, data models created in most programming languages like Python, JavaScript and R require an understanding of programming syntax fundamentals.
Related Article: Beating the Spreadsheet Blues
How Has Excel Changed?
A number of advancements have shifted the workflow value from an Excel sheet. The first is the increase in the amount of data. New database structures have revolutionized the access business users have to data. Spreadsheets previously held vast amounts of data, formulas and tables. But with the advent of the cloud making data acquisition and storage more convenient, analysts should ask whether data applications in a spreadsheet are enough or would a database be a better choice?
A second is the rise in the number of custom-made applications for Excel. Some analysts became savvy about Visual Basic for Applications (VBA), the proprietary programming language for enhancing features of Microsoft applications.
Developers have taken this a further step by introducing Excel plugins that add statistical and API functionality. I once used a plugin, Supermetrics, to import Google Analytics data into an Excel spreadsheet. It allowed me to audit my client’s metrics using more combinations for dimensions and metrics than in the original dashboards, revealing influential trends and increasing the quality of the analysis.
Business users today clearly have bigger expectations of spreadsheets. With the right plugin, spreadsheets can enhance the quality of ingested data from a variety of sources.
Unfortunately many managers become overly comfortable with how they’ve always used Excel and are slow to adopt solutions beyond Excel’s basic capabilities. Not everyone is aware of Excel competitor Google Sheets, let alone Python or R for data mining. When businesses rely on Excel spreadsheets without care for its limitations, costly errors occur. The Verge reported that 16,000 United Kingdom COVID-19 cases were omitted from pandemic records because of an Excel sheet reached the upper limit of its capacity.
Related Article: The Problem of Adding AI to Excel
When Do Spreadsheets Hurt Analytics Efforts?
Spreadsheets become a liability when the flat design of the file sizes come up against the dataset size. An Excel file structure is more than enough to experiment with data fields, but aren’t a great fit for large datasets. In that case, a program connected to a database would make data easier to parse, particularly if the data values constantly change and table concepts like key value pairs are important for queries.
That leads to a second caution: version control. Spreadsheet files can be unwieldy for historical data analysis if the history is not captured accurately and displayed intuitively. When an organization decides to update the spreadsheet, it risks losing huge amounts of historical data. There’s also a risk of accidentally breaking a complex cell formula, which then passes incorrect information to a decision maker in turn.
When Do Spreadsheets Help?
Despite advances in data management, spreadsheets remain relevant in some important scenarios. Think of a prototypical data audit. A simple audit eliminates the need for real-time updates and collaboration. In these cases, the auditing is done to get a sense of what numbers and calculations work. It’s a temporary solution which won’t require ongoing maintenance, such as updating data due to a change in API specifications.
Overall analysts should use spreadsheets in the early stages to develop an initial idea with the goal of moving into a more stable software solution if needed. The ideas can spark further programming needs if the data is applied into a largest set being queried in SQL, Python or R Programming.
Excel spreadsheets can be a good stop-gap measure for managing marketing data for analysis. By keeping a close eye on any changes or updates in the spreadsheets, you’ll hopefully avoid the problems, data loss, and extreme costs misuse can bring.
Pierre DeBois is the founder of Zimana, a small business digital analytics consultancy. He reviews data from web analytics and social media dashboard solutions, then provides recommendations and web development action that improves marketing strategy and business profitability.


